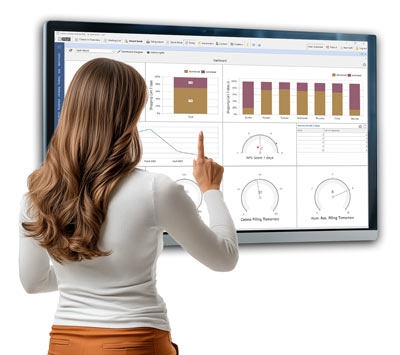
These reports are accessible from the dashboard and can be customized to meet your specific needs.
Using the reports available in xPlan, you can track and analyze your performance effectively, allowing you to make informed decisions and optimize your strategies to improve profitability and growth.

Statistics make it possible to track trends in the data, such as changes in consumption patterns or seasonal variations. This can help companies anticipate market fluctuations and adapt their strategies accordingly.
Statistics can help identify new business opportunities by identifying trends and patterns in data. This can help you develop new products and services, or open up to new markets.
xPlan has more than 400 customizable reports and statistics to create thousands of different reports.
These reports provide information about your overall performance, such as number of appointments, revenue, occupancy rate, and conversion rate.
These reports provide information about your customers, such as their visit frequency, purchases, reviews, and ratings.

These reports provide insights into your employees' productivity, such as the time spent on each appointment, the number of appointments completed, and the revenue generated.
Provide you with detailed information about your sales, such as sales by category, sales per employee, and sales by period.
If you ever need a very specific report that we don’t have, we’ll be happy to create it for our user community.

Our advisors can help you find the most relevant KPIs.
Faites vous du bien, arrêtez d’hésiter, prendre xPlan c’est facile et vous donne une liberté inégalée. Unifions nos forces.